
Full-Time-Series Phenotype Monitoring System
Background
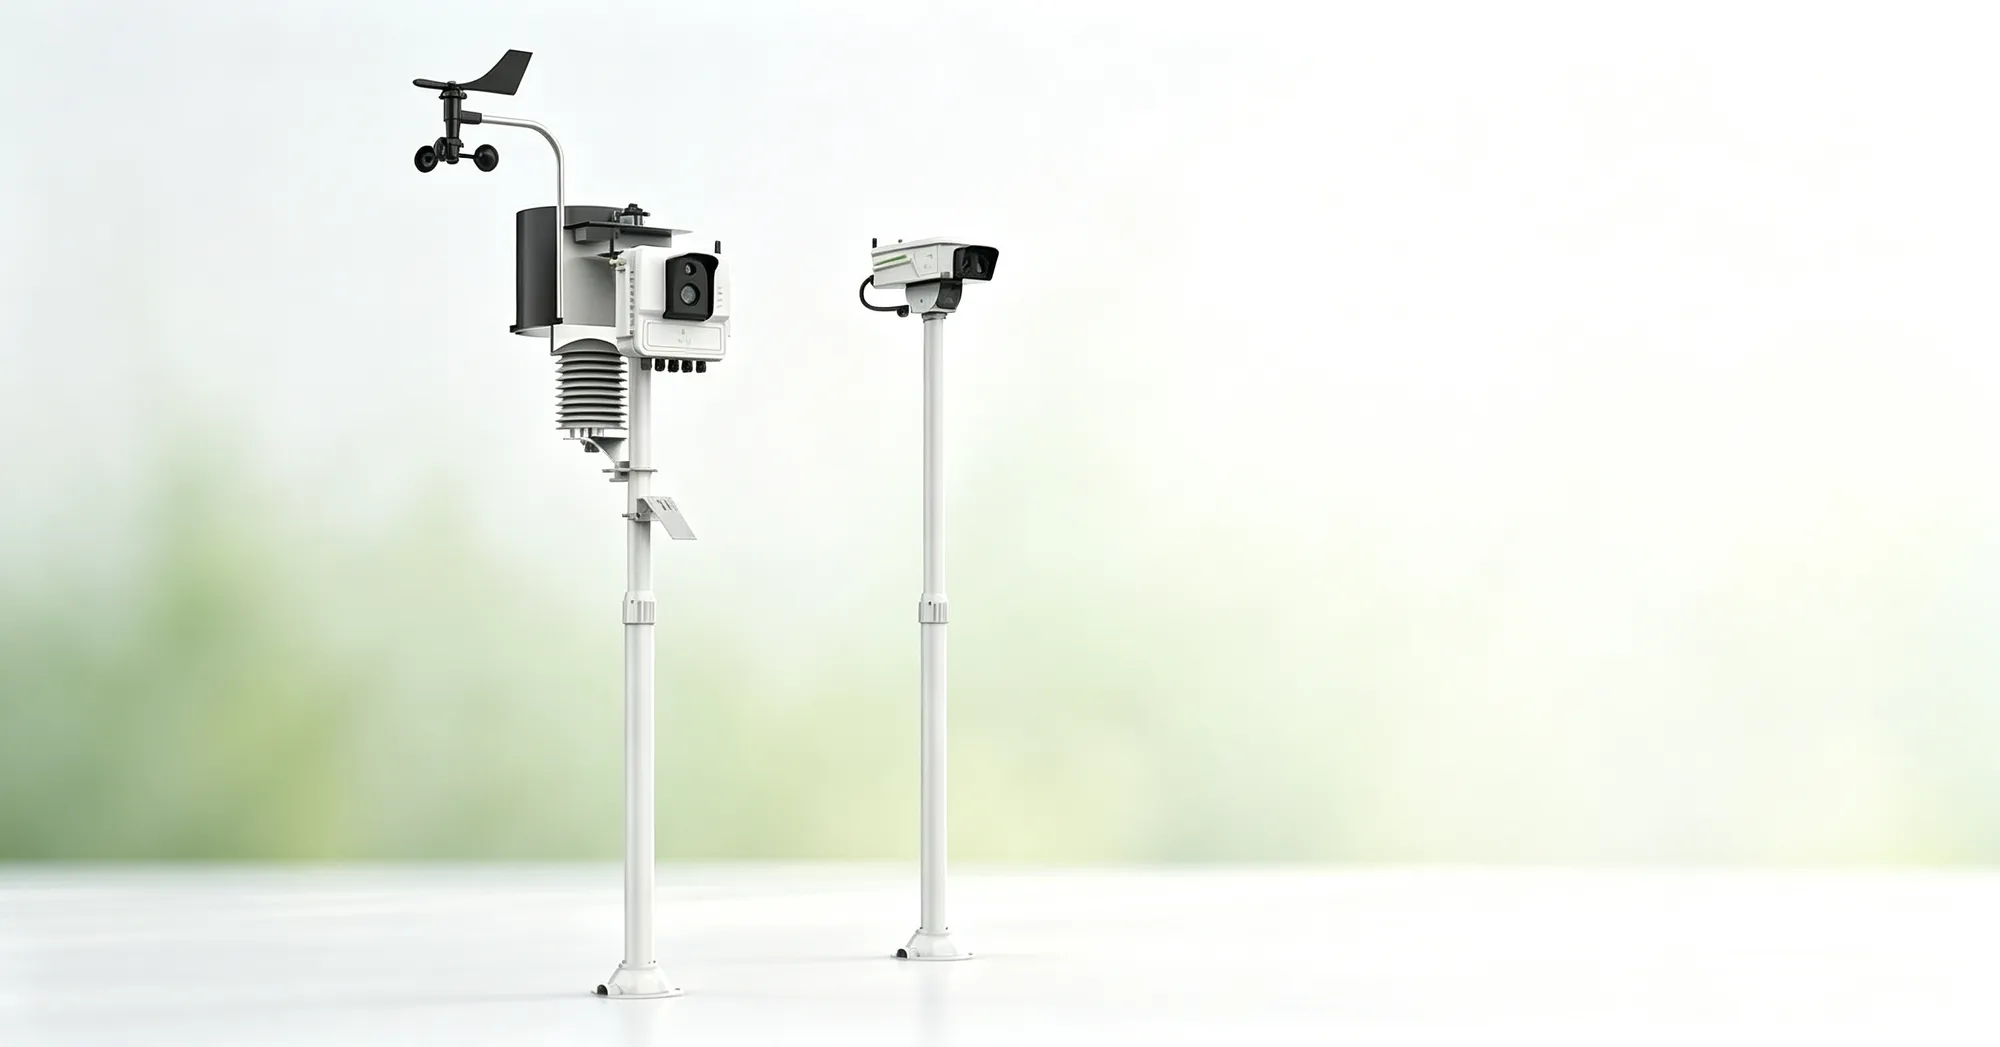
The Plant IoT - Full-Time-Series Phenotype Monitoring System - PhenoSight is an Internet of Things (IoT)-enabled phenotyping platform designed to be simple and easy to use for a wide range of applications in any environment. It is accompanied by an automated field control system, high-throughput trait analysis algorithms and machine learning-based modelling to manage and process the data generated by the platform in order to explore the dynamic relationships between genotypes, phenotypes and the environment.
Challenge
PhenoSight requires a plot division of the experimental field, which is recommended to be 1 m * 2 m. PhenoSight consists of a server and terminal nodes, and IoT-enabled IoT is largely dependent on the connection between the two. the PhenoSight server itself is also a measurement device, and it can be connected to 9 terminal nodes at the same time, which creates the plot division model shown in the schematic diagram of the implementation plan ( shown in the red box below). Where the red unit is the server and the blue unit is the terminal node. Each server and terminal node is equipped with a visible light imaging unit, and each server can be connected to temperature and humidity sensors, soil parameter sensors, chlorophyll fluorescence sensors, etc., which can measure the plant phenotype while adding environmental factors to the plant growth model, so that, in addition to the measurement of phenotypic parameters, it can also be realised that it is possible to predict the plant's growth under the environment, which has great significance for guiding agricultural production. production. All PhenoSight data can be transferred to the cloud for cloud processing.
Solution
Real-time crop phenotype monitoring Automated real-time continuous monitoring of crop growth and development through low-cost field terminal workstations; Integrated field meteorological monitoring Records a range of meteorological data: photosynthetically active radiation, leaf canopy temperature, air temperature and humidity, soil temperature and humidity with conductivity; High-throughput analysis process High-throughput processing and quantification of crop growth modelling and adaptation performance; Hyperspectral measurements Hyperspectral measurements can be made on plots to analyse the amount of relevant inclusions Plant stomatal phenotyping The system is based on modern Internet of Things (IoT) technology, coupled with multi-camera stomatal continuous monitoring terminals, and the development of deep-learning image analysis algorithms, which can realise large-scale, multi-species cluster deployment of stomatal monitoring terminals Rice flowering time sequence analysis Rice flowering time sequence can be analysed.
Results
Performance: real-time field analysis Mobility: easy to install and use Affordability: competitively low costs Durability: continuous operation under field conditions Predictive: Combining phenotypic data and environmental factor data enables prediction of future plant growth.
"Plot plant type, plant height, canopy, canopy tightness, leaf colour, leaf size and other measurements; Plant growth dynamics change, growth rate research, such as plant fertility flowering change monitoring; Plant environmental response studies (development required), e.g. physiological studies of drought, irrigation, fertilisation, etc; Allows scalable phenotyping based on machine learning; Joins GxE, genotype and environment interactions."
— Research Director