High-throughput Plant Phenotyping System——PhenoWatch
背景
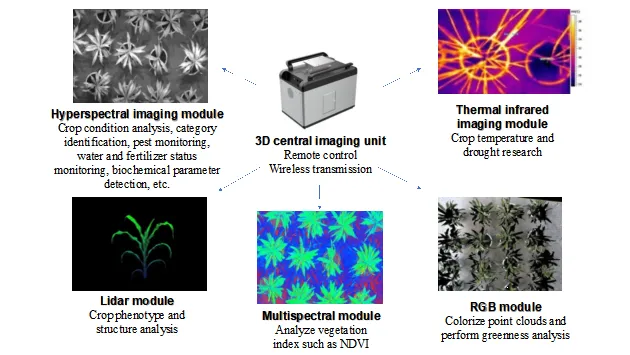
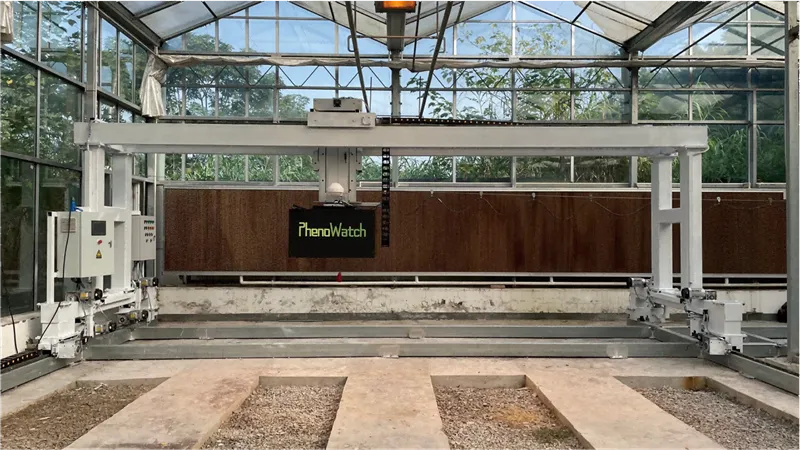
The PhenoWatch high-throughput plant phenotype analysis system deeply integrates multiple measurement units such as lidar, RGB imaging, multispectral imaging, infrared thermal imaging, hyperspectral imaging, etc., to generate three-dimensional images with multi-spectral information, and to perform single group planting. Plant identification, separation of stems and leaves of individual plants, accurate acquisition of phenotypic parameters such as plant height, plant width, leaf length, leaf width, leaf inclination, and leaf area, and calculation and analysis of spectral characteristics and vegetation index. Analysis, crop temperature and drought research, crop condition analysis, category identification, pest monitoring, water and fertilizer status monitoring, biochemical parameter detection and other analysis.
解决方案
Phenotypic parameters for population DEM: Digital elevation model, the digital expression of terrain surface form. DSM: Digital surface model, a ground elevation model that includes the heights of surface buildings, bridges, and vegetation. CHM: Canopy height model, subtracting the digital elevation model from the digital surface model Canopy Cover: The vertical projection of crops as a percentage of the field. Transmittance: It can reflect the light transmittance of the crop canopy from top to bottom, and understand the structural details of the canopy of light and ventilation. 3D point cloud vegetation index: 3D NDVI、3D TVI、3D RVI、3D DVI 2D vegetation index: 2D NDVI、2D TVI、2D RVI、2D DVI Vegetation index statistics: statistics of multi-spectral vegetation index, such as mean, maximum, minimum, etc. Greenness: custom threshold, reflecting the greenness of plants Infrared thermal imaging analysis: image pixel temperature, plant canopy temperature (with thermal infrared imaging unit)